Water Year - Rain Data from Kalama Washington
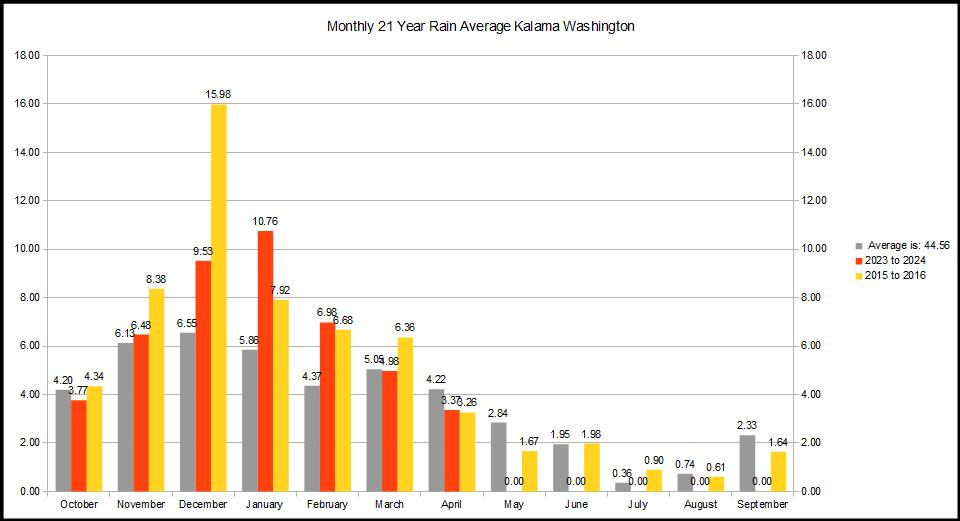
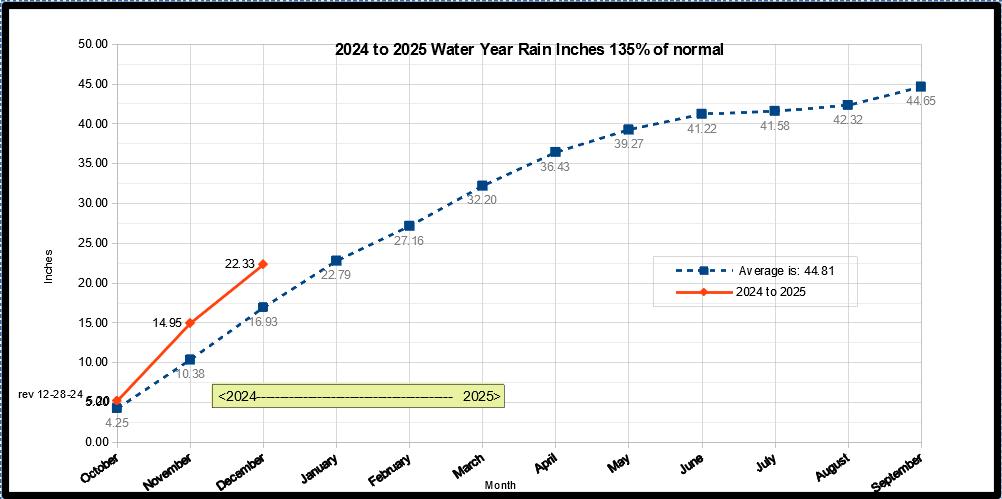
In October of each year since 2003, the data is analized for the prior Water Year with the data from our manual rain gauge and a Davis pro 6153 weather station. These graphs show the Prism 21-year normal (2003 up through 2024 water year) monthly data and the cumulative rain data for our station (docmarvweather). Starting with water year 2024_2025, the Prism 20-year normal uses years 2003-2024.
22 Year Rain Average Kalama Washington - ending with 44.81" of normal precipation
Water Year 2024 to 2025 - ending with 139% of normal precipation (22.84 v.s. 16.93 inches normal)
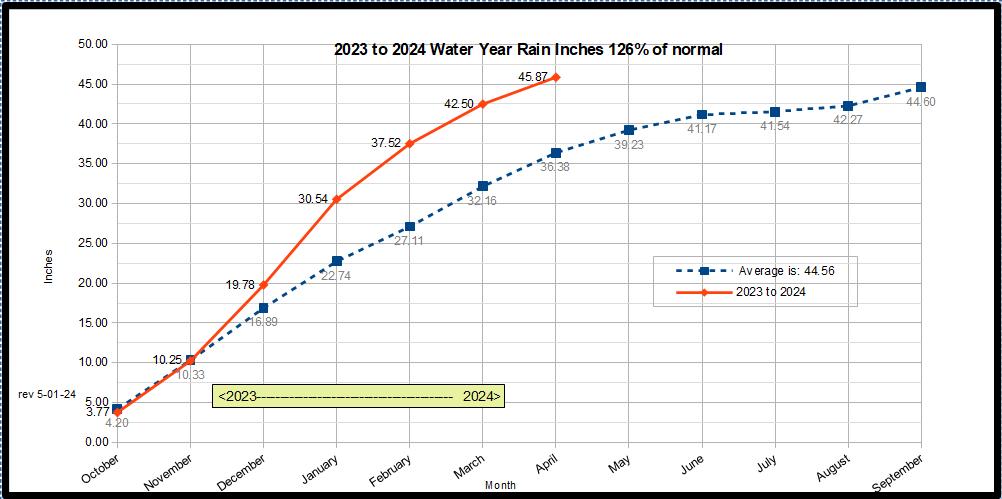
Water Year 2023 to 2024 - ending with 121% of normal precipation (54.03 v.s. 44.60 inches normal)
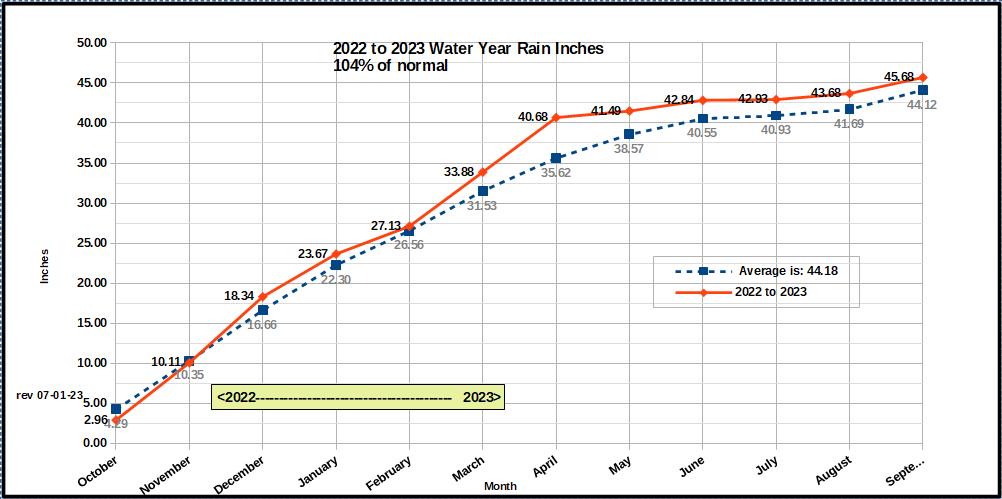
Water Year 2022 to 2023 - ending with 104% of normal precipation (45.73 v.s. 44.12 inches normal)
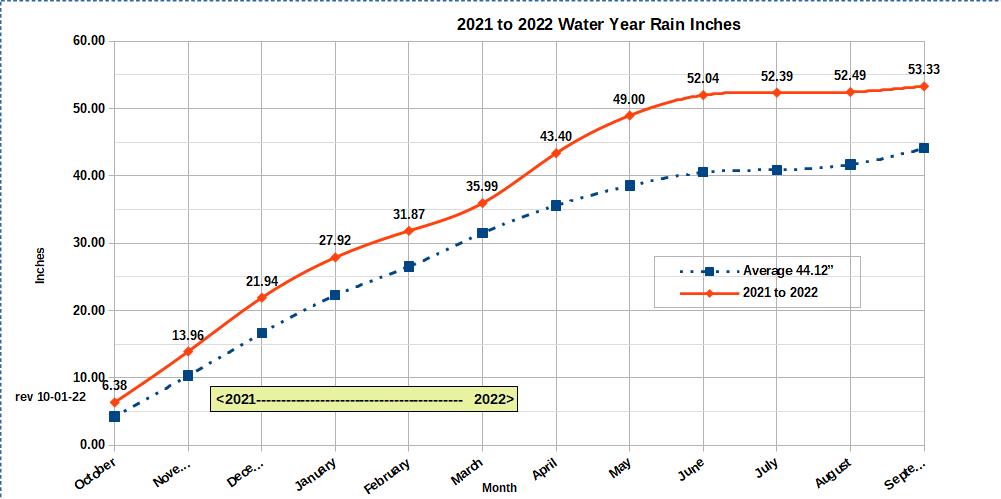
Water Year 2021 to 2022 - ending with 121% of normal precipation (53.33 v.s. 44.12 inches normal)
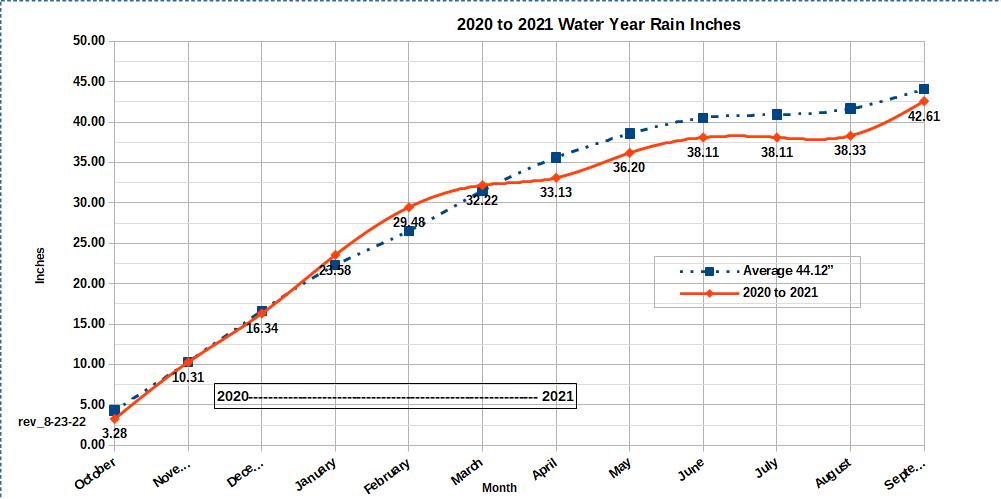
Water Year 2020 to 2021 - ending with 96% of normal precipation (42.61 v.s. 44.12 inches normal)
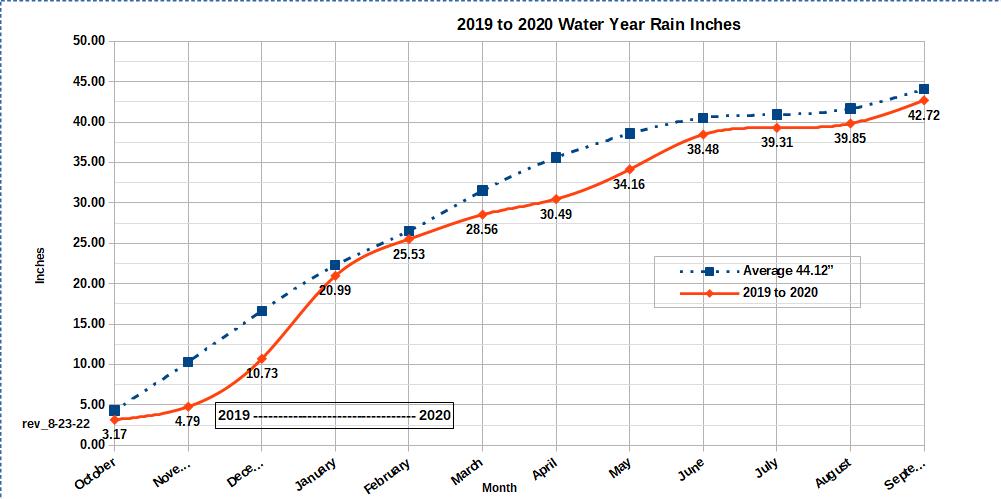
Water Year 2019 to 2020 - ending with 97% of normal precipation (42.72 v.s. 44.12 inches normal)
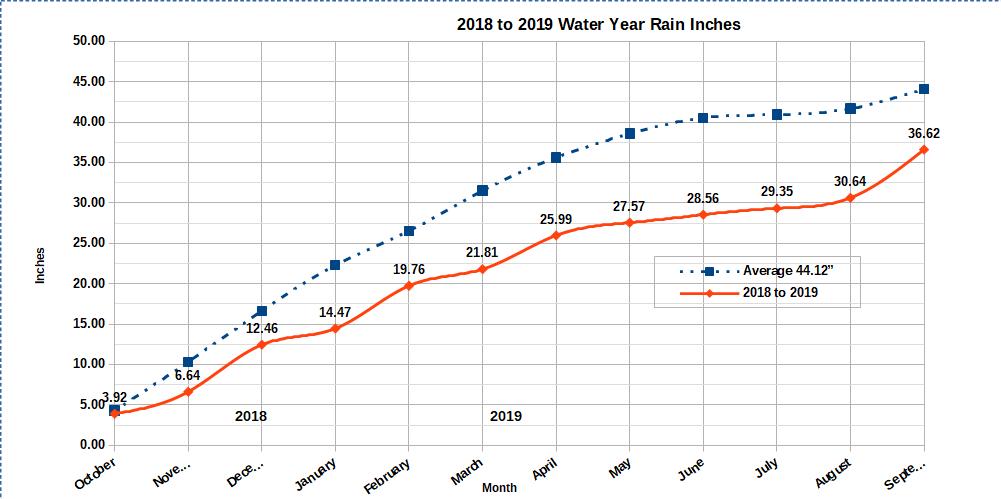
Water Year 2018 to 2019 - ending with 82% of normal precipation (36.62 v.s. 44.12 inches normal)
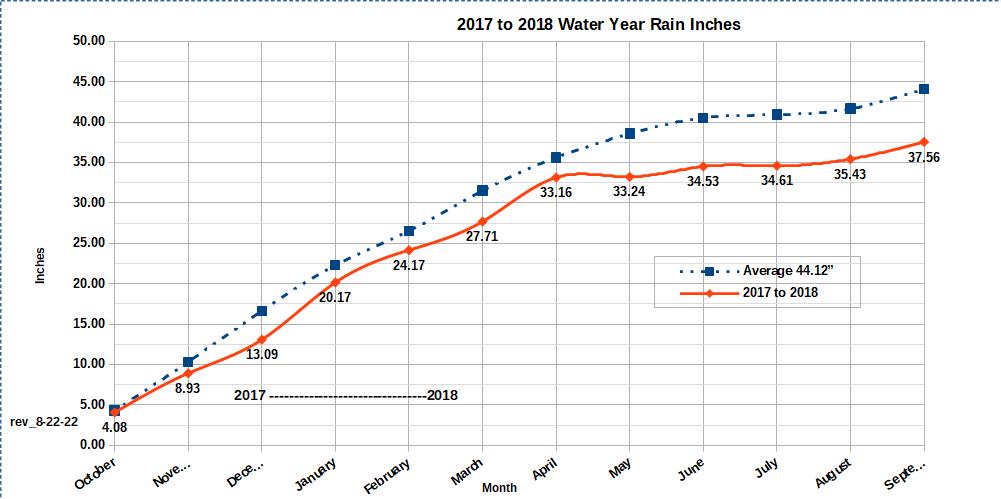
Water Year 2017 to 2018 - ending with 85% of normal precipation (37.56 v.s. 44.12 inches normal)
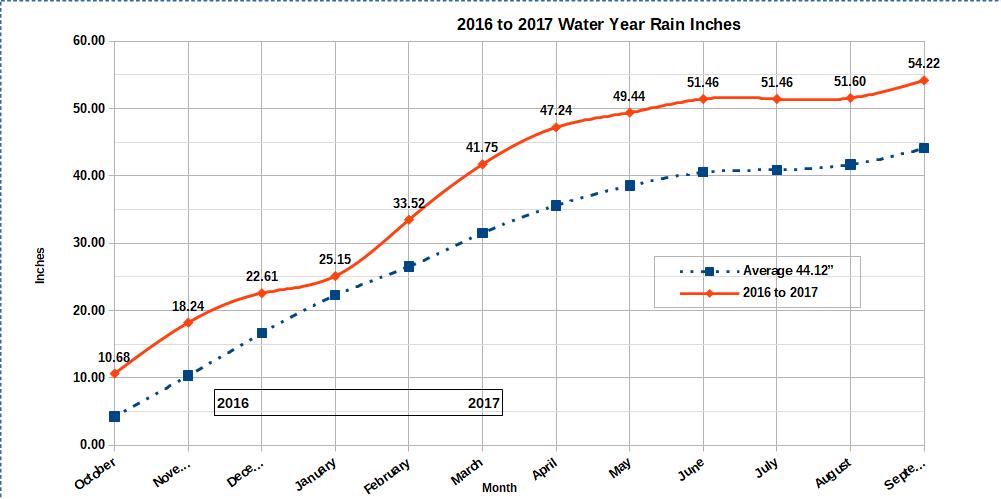
Water Year 2016 to 2017 - ending with 123% of normal precipation (54.22 v.s. 44.12 inches normal)
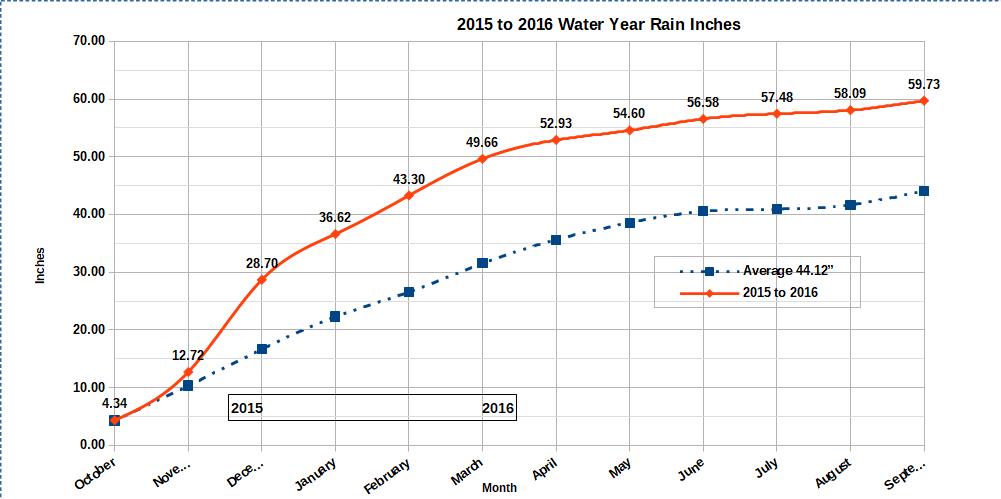
Water Year 2015 to 2016 - ending with 135% of normal precipation (59.73 v.s. 44.12 inches normal)
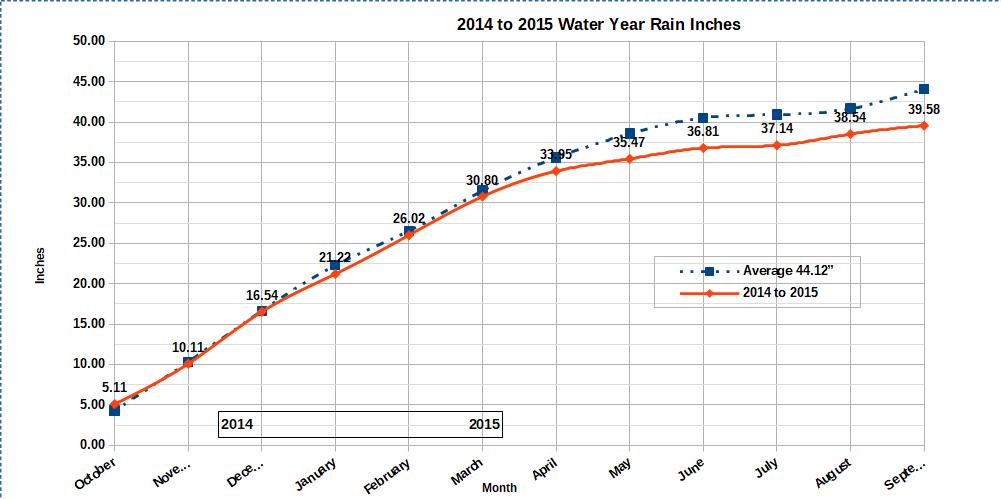
Water Year 2014 to 2015 - ending with 90% of normal precipation (39.58 v.s. 44.12 inches normal)
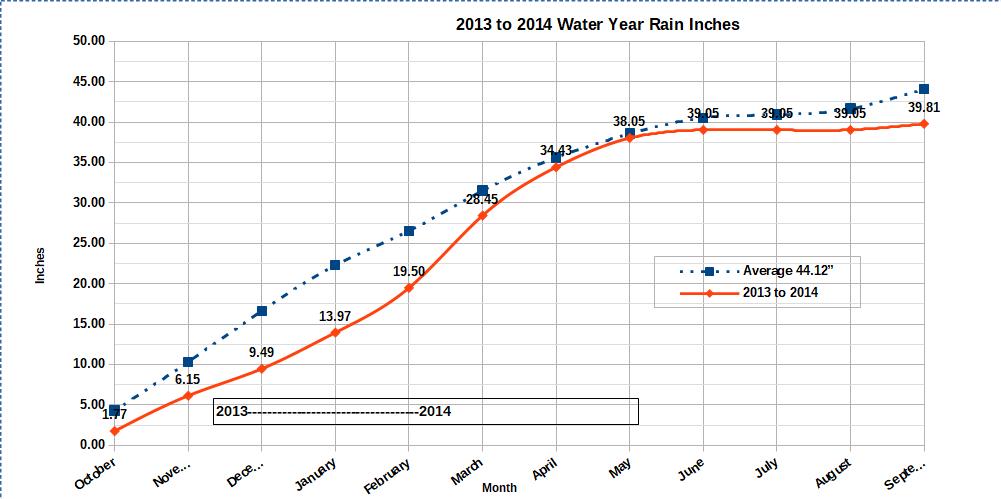
Water Year 2013 to 2014 - ending with 90% of normal precipation (39.81 v.s. 44.12 inches normal)
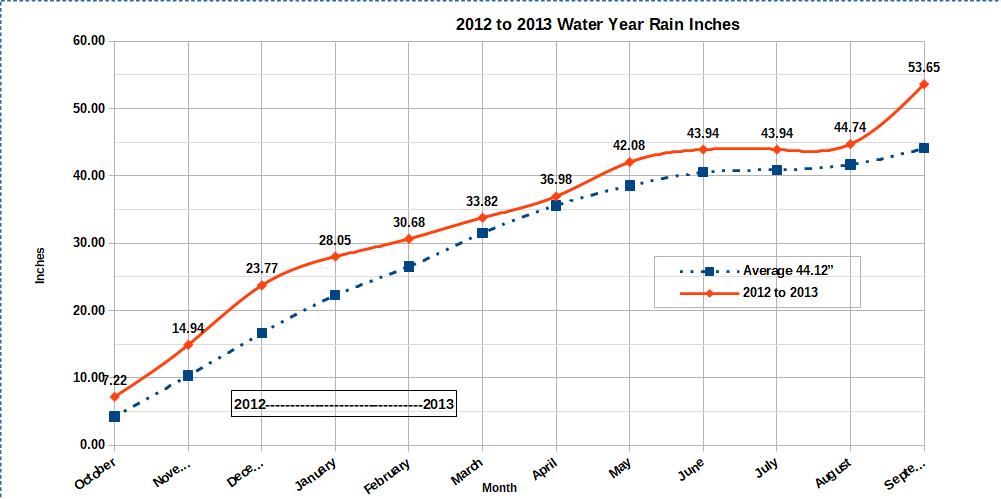
Water Year 2012 to 2013 - ending with 122% of normal precipation (53.65 v.s. 44.12 inches normal)
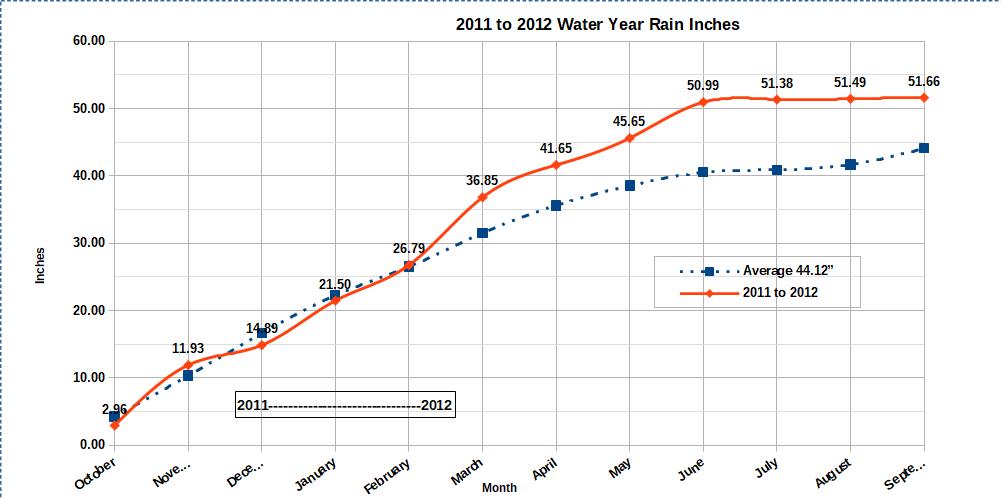
Water Year 2011 to 2012 - ending with 117% of normal precipation (51.66 v.s. 44.12 inches normal)
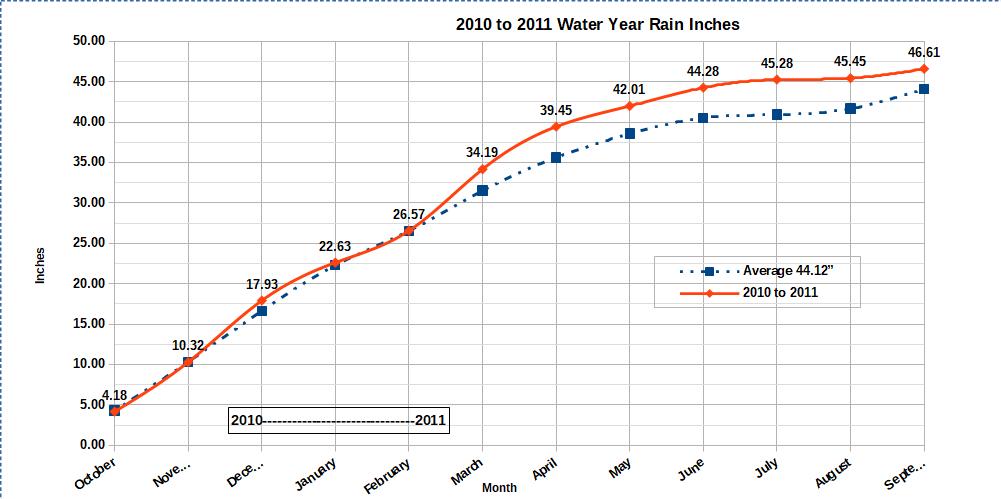
Water Year 2010 to 2011 - ending with 106% of normal precipation (46.61 v.s. 44.12 inches normal)
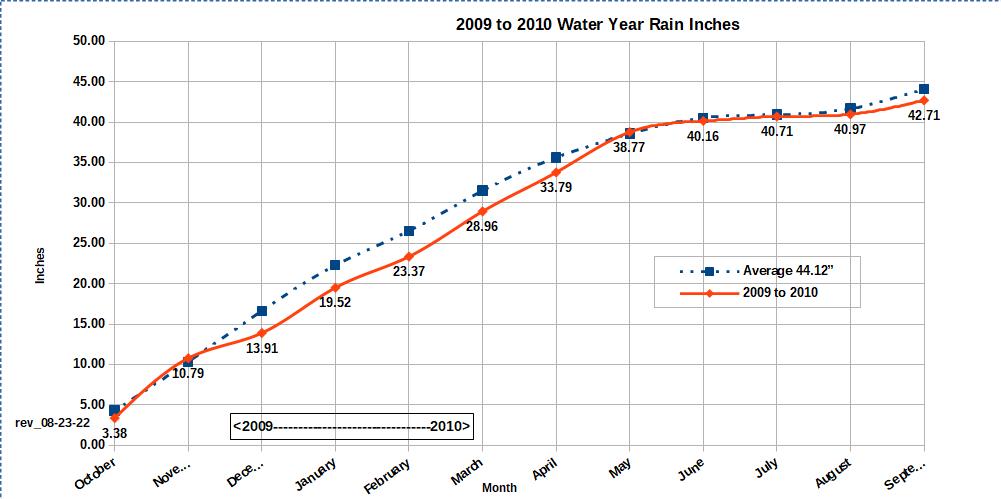
Water Year 2009 to 2010 - ending with 97% of normal precipation (42.71 v.s. 44.12 inches normal)
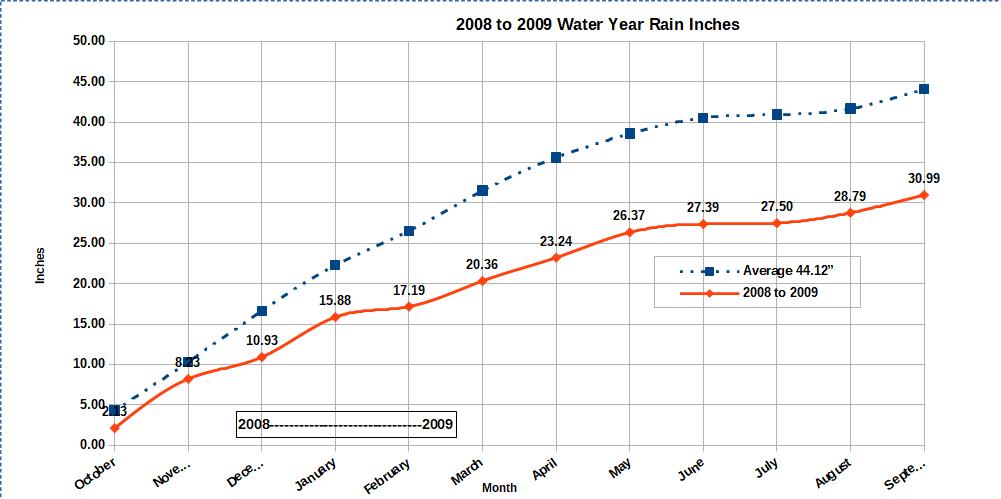
Water Year 2008 to 2009 - ending with 70% of normal precipation (30.99 v.s. 44.12 inches normal)
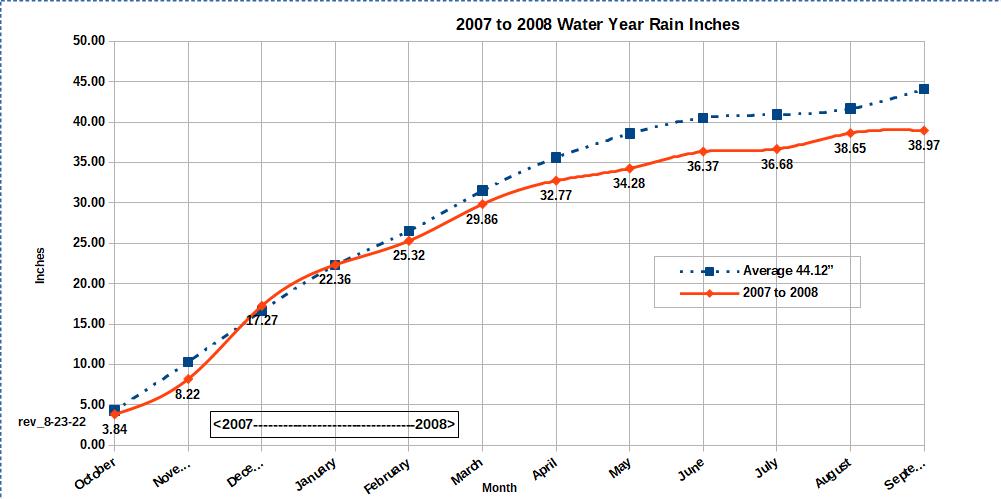
Water Year 2007 to 2008 - ending with 88% of normal precipation (38.97 v.s. 44.12 inches normal)
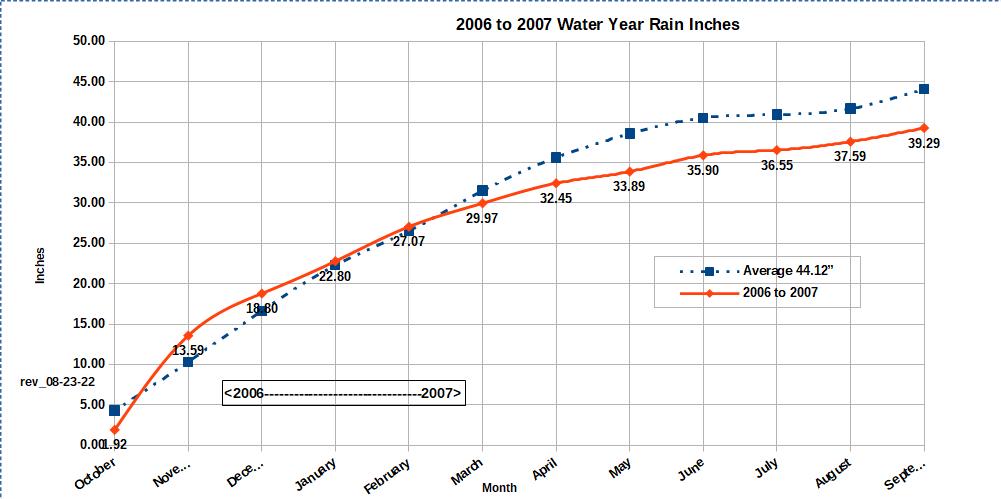
Water Year 2006 to 2007 - ending with 89% of normal precipation (39.29 v.s. 44.12 inches normal)
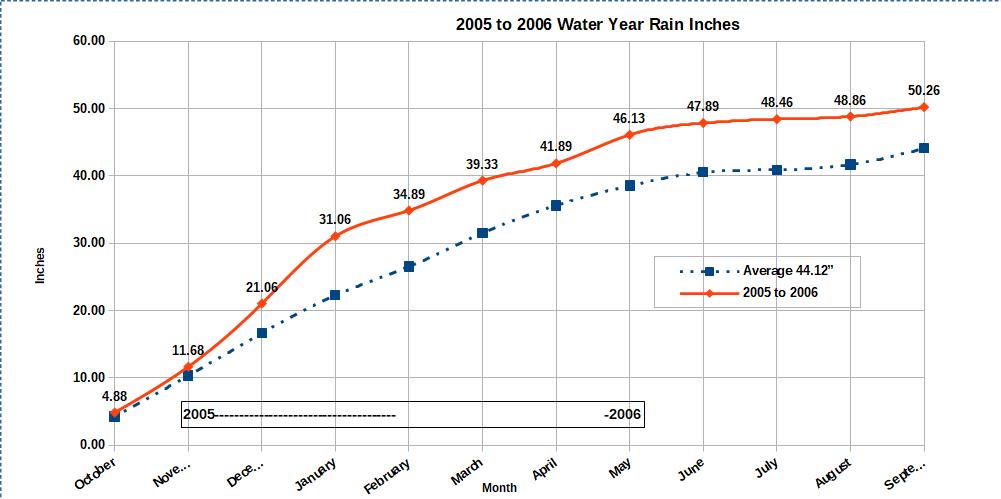
Water Year 2005 to 2006 - ending with 114% of normal precipation (50.26 v.s. 44.12 inches normal)
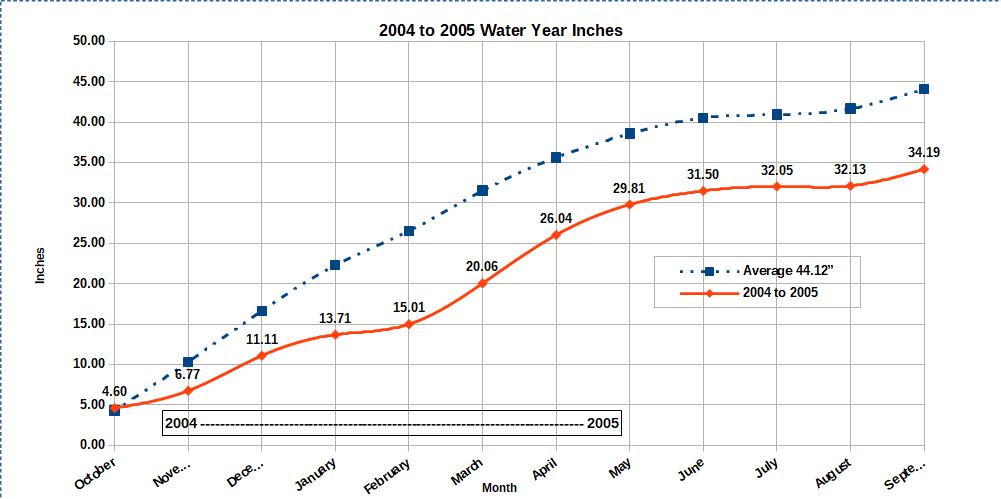
Water Year 2004 to 2005 - ending with 78% of normal precipation (34.19 v.s. 44.12 inches normal)
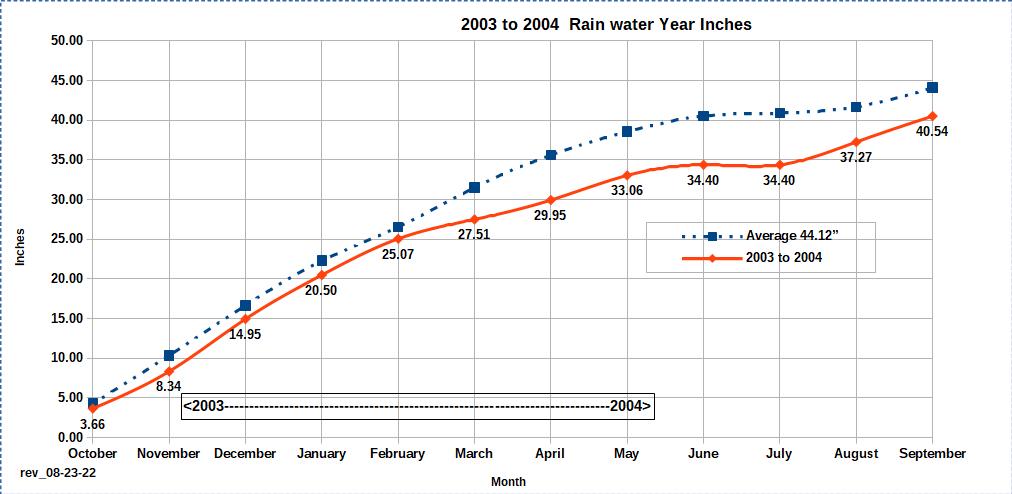
Water Year 2003 to 2004 - ending with 92% of normal precipation (40.54 v.s. 44.12 inches normal)
Natural Resourses Consevation Service National Water and Climate Center
